- 2020 VICTIMS BY AGE GROUP
- 2020 - TOP 20 INTERNATIONAL VICTIM COUNTRIES
- 2020 - TOP 10 STATES BY NUMBER OF VICTIMS9
- 2020 - TOP 10 STATES BY VICTIM LOSS10
- 2020 CRIME TYPES
IC3 by the Numbers6
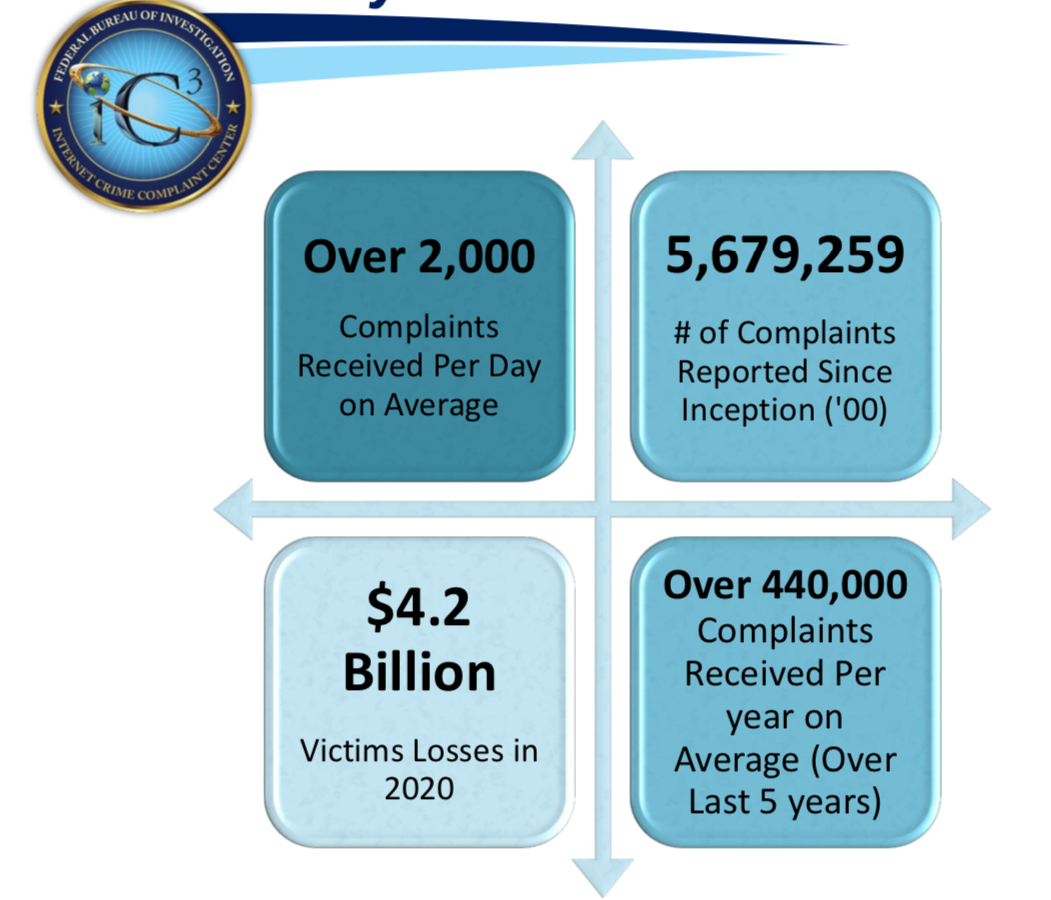
6 Accessibility description: Image depicts key statistics regarding complaints and victim loss. Total losses of $4.2 billion were reported in 2020. The total number of complaints received since the year 2000 is 5,679,259. IC3 has received approximately 440,000 complaints per year on average over the last five years, or more than 2,000 complaints per day.
2020 VICTIMS BY AGE GROUP

7 Not all complaints include an associated age range—those without this information are excluded from this table. Please see Appendix B for more information regarding IC3 data.
2020 - TOP 20 INTERNATIONAL VICTIM COUNTRIES
Excluding the United States8 
8 Accessibility description: Image includes a world map with labels indicating the top 20 countries by number of total victims. The specific number of victims for each country are listed in descending order in the text table immediately below the image. Please see Appendix B for more information regarding IC3 data.
2020 - TOP 10 STATES BY NUMBER OF VICTIMS9

2020 - TOP 10 STATES BY VICTIM LOSS10

9 Accessibility description: Image depicts a map of the United States. The top 10 states based on number of reporting victims are labeled. These include California, Florida, Texas, New York, Illinois, Pennsylvania, Washington, Nevada, New Jersey, and Maryland. Please see Appendix B for more information regarding IC3 data.
10 Accessibility description: Image depicts a map of the United States. The top 10 states based on reported victim loss are labeled. These include California, New York, Texas, Florida, Ohio, Illinois, Missouri, Pennsylvania, Virginia, and Colorado. Please see Appendix B for more information regarding IC3 data.
2020 CRIME TYPES

 ** Regarding ransomware adjusted losses, this number does not include estimates of lost business, time, wages, files, or equipment, or any third-party remediation services acquired by a victim. In some cases, victims do not report any loss amount to the FBI, thereby creating an artificially low overall ransomware loss rate. Lastly, the number only represents what victims report to the FBI via the IC3 and does not account for victim direct reporting to FBI field offices/agents.
Last 3 Year Complaint Count Comparison


2020 Overall State Statistics
 *Note: This information is based on the total number of complaints from each state, American Territory, and the District of Columbia when the complainant provided state information. Please see Appendix B for more information regarding IC3 data.
  *Note: This information is based on the total number of complaints from each state, American Territory, and the District of Columbia when the complainant provided state information. Please see Appendix B for more information regarding IC3 data.
  *Note: This information is based on the total number of complaints from each state, American Territory, and the District of Columbia when the complainant provided state information. Please see Appendix B for more information regarding IC3 data.
  *Note: This information is based on the total number of complaints from each state, American Territory, and the District of Columbia when the complainant provided state information. Please see Appendix B for more information regarding IC3 data.